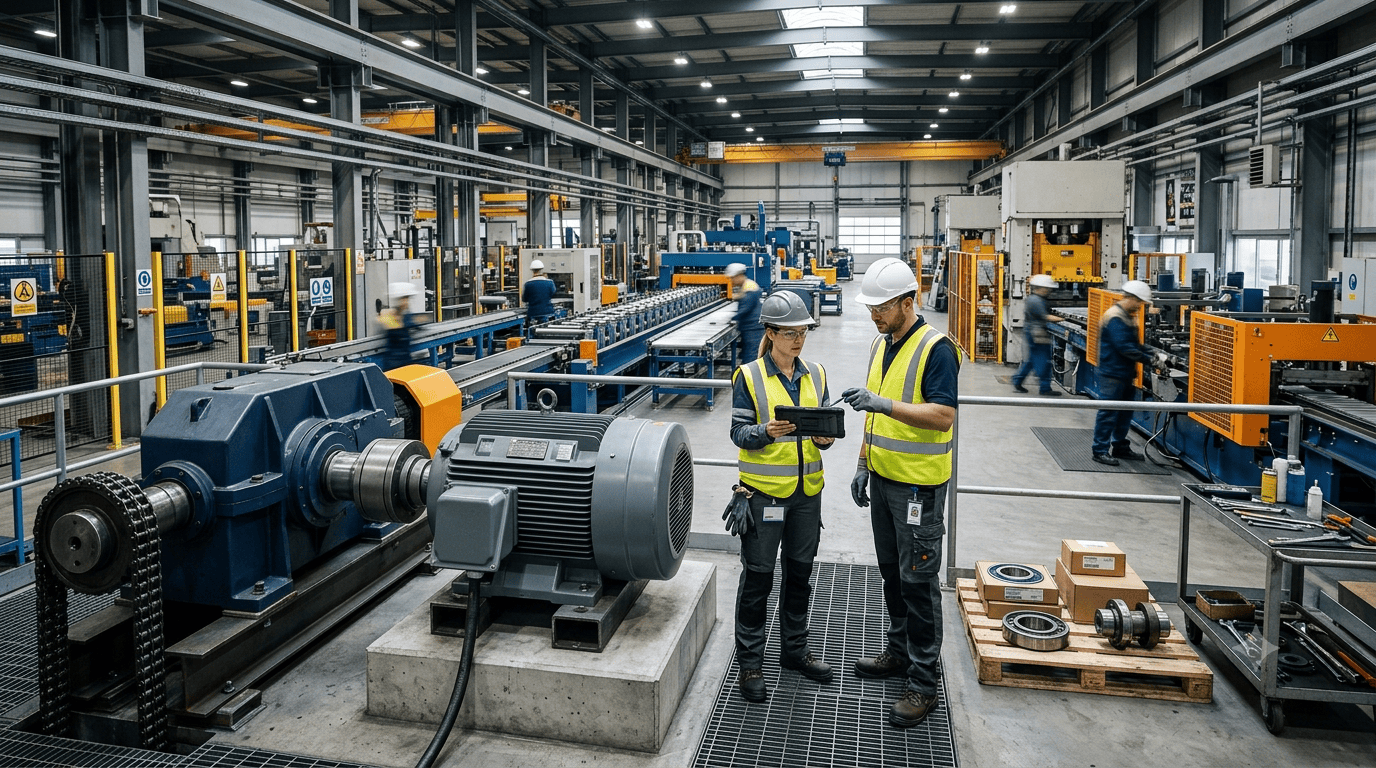
A series of industrial earnings reports released over the past several weeks—and capped by Parker Hannifin’s results on August 6—suggests that a potentially important shift is occurring inside the industrial equipment market.
Demand is not strengthening only on the new-equipment side.
Replacement parts, aftermarket services and MRO purchasing are strengthening at the same time.
Parker reported that fourth-quarter orders increased 19% companywide, including 16% in its North American Diversified Industrial businesses and 24% internationally. Total backlog reached a record $12.8 billion. Parker also said the industrial recovery was broadening and reported sales improvement across all market verticals.
That would be noteworthy on its own. It becomes more significant when compared with Flowserve, which recently reported record aftermarket bookings of $695.8 million, up 12.1%, at the same time that original-equipment bookings surged 43.9%. Fastenal’s second-quarter data separately showed direct materials used in production growing 16.5% while indirect materials supporting maintenance, operations and facilities grew 14.1%. Genuine Parts Company’s industrial business, which operates primarily under the Motion brand, reported 7.1% sales growth, including 6.1% comparable growth.
These companies sell very different products into different industrial markets. Their results therefore do not constitute a direct measurement of industrial gearbox demand, gearbox repair-shop capacity or gearbox lead times.
Taken together, however, they reveal something maintenance and reliability teams should investigate at their own facilities:
The industrial recovery may be placing stronger demand on both sides of the equipment lifecycle simultaneously—the equipment being built and the equipment already installed.
That has implications far beyond whether a replacement gearbox is technically “available.”
Quick Take
Fresh industrial-company results show unusually strong demand appearing simultaneously in new equipment, production materials, replacement parts and aftermarket services. The evidence does not establish a broad gearbox shortage or repair-capacity crisis. It does suggest that maintenance teams should revalidate how long a complete gearbox intervention would actually take—from detecting a defect through parts, repair, installation and recommissioning—before a developing problem becomes an emergency.
The Pattern Across the Industrial Supply Chain
| Indicator | Latest reported change | Why it matters |
|---|---|---|
| Parker overall orders | +19% | Broad forward-demand signal |
| Parker North American industrial orders | +16% | Stronger industrial demand |
| Parker international industrial orders | +24% | Recovery not limited to one U.S. market |
| Flowserve OE bookings | +43.9% | Large increase in new-equipment/project demand |
| Flowserve aftermarket bookings | +12.1% | Record aftermarket bookings |
| Fastenal direct materials | +16.5% | Production/OEM purchasing strength |
| Fastenal indirect materials | +14.1% | MRO/facility purchasing strength |
| GPC Industrial / Motion sales | +7.1% | Industrial replacement-parts growth |
| GPC Industrial comparable sales | +6.1% | Growth not primarily acquisition-driven |
| Timken Engineered Bearings | +3.8% | Bearing demand improved |
| Timken Industrial Motion | +14.6% | Strong motion-platform growth |
| SKF Bearing Solutions | Flat organically | Important evidence that the recovery is not universal |
The most important conclusion in that table is not any single percentage.
It is the coexistence of stronger OEM and aftermarket activity.
Parker’s August 6 Results Are the Breaking-News Signal
Parker Hannifin gives this story its immediate news peg.
On August 6, Parker reported fiscal fourth-quarter sales of a record $5.8 billion, up 9.8%, with organic sales increasing 8%. Its North American Diversified Industrial business produced 4.9% organic growth, while international Diversified Industrial sales grew 6.5% organically. Parker said industrial recovery was broadening and that sales improved across all market verticals.
The order data were even more striking.
Parker reported fourth-quarter order rates of:
- +19% companywide
- +16% in Diversified Industrial North America
- +24% in Diversified Industrial International
- +18% in Aerospace Systems
Its total backlog increased to a record $12.8 billion.
The acceleration within industrial orders deserves particular attention.
Using Parker’s previously disclosed methodology, North American Diversified Industrial order rates moved from 3% in fiscal Q1 2026 to 7%, 7%, and then 16% in Q4. International Industrial orders moved from 6% to 6%, 6%, then 24%. Parker is changing its order-comparison methodology beginning in fiscal 2027, so those figures need to be read in the context provided by the company, but the direction of change remains significant.
Parker itself forecasts what it calls a broadening industrial recovery during fiscal 2027.
That is a company outlook rather than independent proof of what the entire industrial economy will do. But it provides a fresh forward-looking signal from one of the world’s largest motion-and-control suppliers.
Read Parker Hannifin’s August 6 fiscal 2026 results
Industrial Gearbox Solutions Editorial Insight
Rising OEM orders matter to maintenance even when a plant is not purchasing new equipment. New production ultimately competes for some of the same bearings, machining capacity, materials, engineering resources, logistics and supplier attention required to maintain the installed base.
Flowserve Reveals the Two-Sided Demand Pattern Most Clearly
Flowserve provides perhaps the clearest example of why this story is more complex than an ordinary industrial-recovery article.
The company reported second-quarter original-equipment bookings of $652.3 million, up 43.9%, while aftermarket bookings reached a record $695.8 million, up 12.1%.
Total bookings increased 25.5% to $1.348 billion, while backlog increased 16.9% to $3.336 billion.
In other words, new-equipment demand and aftermarket demand were both strong at the same time.
That matters because Flowserve’s aftermarket business serves an installed base of industrial assets that require parts, service and lifecycle support. Pumps and valves are not industrial gearboxes, but the operating model is familiar to almost every reliability organization: plants need new equipment for expansion and replacement while simultaneously maintaining equipment already in service.
Flowserve’s results also contain a useful warning against oversimplification.
Reported Q2 sales actually declined 1.6%, and organic sales declined 3.3%, despite the sharp increase in bookings. The company also lowered its full-year organic-sales outlook to approximately negative 1%, citing disruption associated with conflict in the Middle East.
So this is not evidence of universal industrial acceleration.
It is evidence that future workload represented by orders can strengthen even while current revenue and operating conditions remain uneven.
For a maintenance organization, that distinction is worth understanding. Supplier workload tomorrow may not be visible in today’s shipment numbers.
Read Flowserve’s Q2 2026 results
Fastenal Shows Production and MRO Purchasing Rising Side by Side
Fastenal provides another unusually useful data point because it separates sales between direct and indirect materials.
The company defines direct materials as products incorporated into finished goods or directly supporting production processes. Indirect materials support facility operations, maintenance and safety.
During Q2:
Direct materials daily sales increased 16.5%.
Indirect materials daily sales increased 14.1%.
Heavy-manufacturing sales increased 18.1%, while manufacturing overall increased 14.9%.
Again, those percentages should not be mistaken for pure market-volume growth. Fastenal says its overall 14.7% daily-sales increase reflected market-share gains with large customers, pricing and broad-based demand. Pricing contributed to the result, and Fastenal’s managed-spend programs can gain business even without equivalent market growth.
But the relative strength on both sides of the direct/indirect divide is useful.
Plants appear to be buying more material to produce goods while also purchasing more of the products used to maintain and operate facilities.
That is exactly the overlap maintenance planners need to monitor.
Read Fastenal’s Q2 2026 earnings report
Motion’s Parent Company Shows Replacement-Parts Demand Is Growing Too
Genuine Parts Company provides evidence closer to the MRO distribution channel.
Its Industrial Parts Group operates under the Motion brand and serves more than 180,000 MRO and OEM customers across a network of branches and service centers. GPC says roughly 80% of those customers are MRO-related and 20% OEM-related.
During Q2, Industrial sales reached $2.4 billion, up 7.1%.
More importantly, comparable Industrial sales increased 6.1%, while acquisitions contributed only 0.2 percentage point and currency 0.8 point.
Comparable sales strip out acquisition and currency effects and therefore give us a better view of underlying activity inside the business.
Motion distributes bearings, mechanical power-transmission components, automation equipment, fluid-power products and other industrial replacement parts while also operating repair and service capabilities. That makes GPC’s Industrial result particularly relevant to maintenance organizations.
It still does not tell us whether a particular bearing, reducer or coupling has become harder to obtain.
But it is independent evidence that purchasing activity through a major industrial replacement-parts channel has strengthened.
Read Genuine Parts Company’s Q2 results
Timken Brings the Signal Directly Into Bearings and Industrial Motion
Timken’s August 4 results move the evidence even closer to power transmission.
Second-quarter Engineered Bearings sales increased 3.8% to $807.0 million.
Industrial Motion sales increased 14.6% to $453.9 million. Timken said the Industrial Motion increase was driven primarily by higher demand across most platforms and end-market sectors, revenue from the Bijur Delimon acquisition, higher pricing and favorable currency. Overall company organic sales increased 4.4%.
That qualification is important.
The 14.6% increase should not be described as 14.6% organic demand growth. Acquisition revenue, price and currency contributed.
Still, Timken’s results demonstrate higher volumes across both segments and improving customer demand, and the company increased the midpoint of its 2026 revenue-growth outlook to approximately 5.5%.
The relevance to Industrial Gearbox Solutions readers is direct: Timken’s portfolio includes bearings, couplings, industrial gearing, lubrication systems and repair services across industrial markets.
Read Timken’s August 4 Q2 2026 results
Emerson Adds Another Forward-Order Signal
Emerson’s August 4 results provide another independent indication that industrial investment remains active.
The automation supplier reported underlying orders up 7% and underlying sales up 6%, with management citing broad-based growth in North America and Asia. Emerson raised its full-year outlook after the quarter.
Automation orders are not gearbox orders.
But increasing spending on automation, control and production infrastructure often accompanies plant upgrades, capacity changes and new capital projects—activity that can increase demand elsewhere in the industrial equipment ecosystem.
Read Emerson’s Q3 2026 results
The Counterevidence: Bearings Are Not Experiencing a Universal Boom
A responsible interpretation has to explain what the evidence does not show.
SKF reported only 1.4% organic growth during the second quarter.
More significantly, SKF’s Bearing Solutions organic sales were flat compared with the prior-year quarter. Asia continued growing, Europe remained soft and SKF described only early signs of improvement in the Americas OEM market. Management also highlighted continued geopolitical uncertainty.
That is meaningful counterevidence.
If the entire global bearing and power-transmission market were suddenly capacity constrained, we would expect a much more uniformly strong pattern.
We do not see one.
Instead, the evidence points toward a broadening but uneven recovery, with strong order acceleration in some industrial businesses, stronger replacement-part activity in distribution, rising aftermarket demand in several areas and continued weakness in others.
Common Analytical Mistake
Strong orders at Parker, Flowserve or Timken do not prove that industrial gearbox repair shops are full, bearings are unavailable or gearbox lead times are about to increase. Company sales and bookings reflect individual portfolios, pricing, acquisitions, geographic exposure and market-share changes.
The appropriate response is to verify plant-specific conditions—not manufacture a shortage narrative.
The More Important Risk: Two Demand Streams Can Converge on the Same Supply Base
The useful conclusion is therefore narrower and more operational.
Industrial plants are part of two equipment-demand systems.
One supplies new production assets.
The other supports the installed base.
New-equipment demand can require bearings, seals, couplings, motors, gearing, castings, forgings, steel, electronics, controls, machining and engineering resources.
Existing equipment requires many of those same inputs when it is repaired, rebuilt or modernized.
The two markets are not identical. A large custom gear set is not produced on the same line as an off-the-shelf motor coupling, and every supplier has its own manufacturing network.
But there is enough overlap that simultaneous growth in OEM and MRO activity should cause plants to revalidate their assumptions.
A shortage is only the most obvious form of supply constraint.
The next problem may instead be:
a repair facility that can accept a gearbox immediately but cannot begin machining for several weeks;
a bearing that is available while the required gear set is not;
a gearbox replacement that can be manufactured but not before the plant’s outage;
a field-service team whose schedule no longer aligns with commissioning;
an obsolete unit that requires engineering before an interchange can be approved;
or a repairable spare that has never been inspected and turns out to need work before installation.
None of those situations would appear in the news as a “national gearbox shortage.”
All of them can still extend downtime.
Stop Measuring Only Part Lead Time
This leads to what may be the most useful practical conclusion from the current data.
Maintenance organizations should stop asking only:
“How long will the part take?”
The better question is:
How Long Will It Take to Restore the Asset?
For a critical gearbox, the complete timeline may include:
Defect detected → troubleshooting → shutdown approval → removal → freight → teardown → cleaning → inspection → engineering decision → quotation → authorization → bearings/gears/seals procurement → machining → heat treatment when required → assembly → testing → return shipment → installation → alignment → lubrication → commissioning
Industrial Gearbox Solutions recommends treating this full sequence as End-to-End Restoration Time.
Component lead time is only one element.
If a bearing is available tomorrow but teardown cannot occur for two weeks, bearing availability is not controlling the outage.
If the repair facility can work immediately but the gear set requires twelve weeks, the gear set becomes the controlling variable.
If every mechanical component is available but the plant must wait for its shutdown window, operations becomes the controlling variable.
What This Means
For critical rotating equipment, the relevant supply-chain metric is often not part lead time—it is the longest constraint in the complete restoration path.
That is the number maintenance planners should periodically revalidate.
For additional context, see Industrial Gearbox Lead Times Explained.
A Gearbox With a Developing Defect Has Two Clocks Running
Reliability engineering provides another way to think about this issue.
The P-F interval describes the period between the point at which a developing failure becomes detectable and the point at which the asset can no longer fulfill its required function. The Association of Asset Management Professionals notes that understanding this interval helps determine predictive-maintenance inspection frequency and provides enough warning to mitigate the defect before functional failure.
NIST similarly describes asset-condition management as a way to provide condition awareness, diagnostics and estimates of future equipment health that support predictive-maintenance decisions.
That creates two clocks.
Clock One: Remaining Deterioration Window
How much time may remain before the equipment can no longer perform its required function?
Clock Two: End-to-End Restoration Time
How long will the organization need to diagnose, plan, source, repair or replace, install and recommission the equipment?
The critical situation occurs when:
End-to-End Restoration Time > Remaining Deterioration Window
At that point, the gearbox may still be operating—but the plant’s practical options are already shrinking.
This is one reason early detection can have economic value beyond preventing catastrophic failure.
A vibration trend discovered early may allow a scheduled repair, competitive quotations, normal freight and a controlled outage.
The same defect discovered later may require expedited freight, emergency machining, temporary operating decisions or acceptance of whatever replacement can be obtained fastest.
For additional guidance, see Gearbox Condition Monitoring Guide and Gearbox Vibration Analysis: What the Data Really Means.
Pull Quote
“A gearbox does not have to fail before the plant runs out of good options. The decision window can close while the machine is still operating.”
Why Repair-versus-Replace Decisions May Need to Start Earlier
A changing demand environment can also alter a repair-versus-replace decision without changing the physical gearbox.
Suppose an existing reducer has worn bearings and a damaged gear.
If the repair path takes six weeks and a compatible replacement is available in five days, replacement may become more attractive.
If the replacement now requires four months but an experienced repair facility can rebuild the existing unit during the next scheduled outage, repair may carry less operational risk.
The economics depend on actual circumstances.
That is why an old spreadsheet stating that a particular replacement requires “four weeks” is not enough.
Plants should periodically recheck:
- actual replacement availability;
- current repair-shop scheduling;
- component availability;
- engineering requirements;
- expedited freight;
- interchange options;
- internal spare condition;
- outage availability; and
- total downtime exposure.
For the broader decision framework, see When to Repair vs. Replace an Industrial Gearbox.
The Repairable Spare Deserves More Attention
The current market signals also strengthen the case for reviewing repairable spares.
A spare gearbox sitting in a warehouse is not necessarily an available gearbox.
Maintenance teams should confirm whether the unit:
matches the installed ratio;
has the correct shaft configuration;
uses the required mounting arrangement;
is internally complete;
has been stored appropriately;
contains usable lubricant or preservation material;
has experienced corrosion;
uses bearings or seals that have aged during storage;
and can actually be installed without modification.
A damaged or incomplete warehouse spare can create false confidence in the plant’s resilience.
The same logic applies to motors, couplings and other drivetrain components.
For preventive inspection guidance, see Industrial Gearbox Maintenance Checklist.
Questions Maintenance and Reliability Teams Should Ask Now
- Which gearbox failure would create our largest immediate production exposure?
- What is the current replacement lead time—not the lead time recorded last year?
- How quickly could our preferred repair facility begin teardown if the unit arrived today?
- Which components are likely to control repair turnaround: bearings, gears, shafts, seals, machining, heat treatment, engineering or logistics?
- Are there unresolved vibration, oil-analysis or temperature findings on equipment whose restoration time could exceed the estimated deterioration window?
- Have warehouse spares been physically inspected and confirmed as installation-ready?
- Do we have complete nameplate data, drawings, ratio, shaft dimensions, mounting information, motor data and operating history for obsolete critical gearboxes?
- What qualified interchange options exist if the original model is unavailable?
- Does our repair-versus-replace analysis include actual downtime exposure and current lead times?
- If OEM and aftermarket workloads continue strengthening, which maintenance decisions would we wish we had made three months earlier?
What Plants Should Do in the Next 90 Days
The evidence does not justify panic buying.
It does justify targeted verification.
Plants operating production-critical gearboxes should prioritize assets with the highest combination of failure consequence, limited redundancy, uncertain spares, obsolescence and long restoration paths.
Where deterioration is already being monitored, maintenance planners should compare the estimated intervention window with the full restoration timeline, rather than simply the quoted delivery time for one component.
Equipment identification should also be completed before an emergency. Gearbox manufacturer, model, ratio, input/output speeds, shaft configuration, motor information, mounting position, lubrication requirements, photos, drawings and operating history should be accessible to engineering and purchasing.
And when production schedules change, maintenance teams should reassess whether monitoring frequency still provides enough warning time. NIST’s condition-monitoring research emphasizes evaluating monitoring technology within the actual manufacturing and maintenance context rather than treating sensor performance in isolation.
Related: Gearbox Duty Cycles Explained.
What This Evidence Does Not Establish
There is no credible basis in the current evidence for saying the United States is experiencing a generalized industrial gearbox shortage.
There is also no public dataset demonstrating that gearbox repair-shop utilization has reached a particular level nationally.
Company results cannot establish the current lead time for a Falk, Dodge, Flender, SEW-EURODRIVE, NORD, Sumitomo, Radicon, Cone Drive or another particular gearbox.
Different industries are recovering at different rates.
SKF’s flat organic Bearing Solutions sales are especially important because they demonstrate that improving demand remains uneven. Flowserve’s decline in current organic sales despite record bookings provides another reminder that orders, production and shipments can move differently.
Therefore, the appropriate maintenance response is verification rather than speculation.
Ask suppliers.
Ask repair facilities.
Inspect spares.
Review condition data.
Recheck actual quotations.
Document alternatives before an emergency removes the time needed to evaluate them properly.
What to Watch Next
The strongest confirmation of this thesis will not come from another headline declaring that manufacturing is growing.
Industrial Gearbox Solutions will be watching for several more specific signals:
- continued acceleration in Industrial Powertrain Solutions orders from Regal Rexnord and other mechanical power-transmission manufacturers;
- subsequent Timken Engineered Bearings and Industrial Motion order and sales trends;
- Motion/Genuine Parts comparable industrial sales;
- Fastenal’s direct-versus-indirect material sales;
- aftermarket bookings from industrial-equipment OEMs;
- actual gearbox, bearing and motor lead-time changes;
- supplier commentary about machining, castings, forgings, heat treatment and skilled service labor;
- changes in repair-facility turnaround;
- and evidence that backlogs are rising faster than suppliers can convert them into shipments.
The previous Industrial Gearbox Solutions analysis of July manufacturing conditions provides the macroeconomic backdrop: U.S. Manufacturing Accelerates in July—but Slower Deliveries and High Input Prices Raise MRO Risk.
This article addresses the next question:
What happens if stronger production demand and stronger installed-base maintenance demand begin drawing on overlapping industrial resources at the same time?
We do not yet have evidence of a systemic constraint.
We have enough evidence to start measuring for one.
Industrial Gearbox Solutions Editorial Perspective
The latest corporate results do not justify declaring an industrial gearbox shortage.
They reveal something more useful.
A growing number of indicators now show new-equipment demand, production purchasing, industrial replacement-parts activity and aftermarket service demand strengthening simultaneously.
That means maintenance organizations should pay less attention to dramatic shortage predictions and more attention to the actual restoration capacity surrounding their critical assets.
The relevant question is not simply whether a gearbox can be purchased.
It is whether a facility can detect a developing problem, make the engineering decision, obtain the components, secure the repair or replacement capacity, execute the outage and return the entire drivetrain to reliable service before the remaining intervention window disappears.
For critical equipment, early detection creates time.
Accurate equipment records create options.
Verified spares create resilience.
And realistic restoration-time planning protects a plant from discovering too late that the constraint was never the gearbox itself.
It was the time required to get the system reliably running again.
Related Reading
U.S. Manufacturing Accelerates in July—but Slower Deliveries and High Input Prices Raise MRO Risk
Industrial Gearbox Lead Times Explained
When to Repair vs. Replace an Industrial Gearbox
Gearbox Condition Monitoring Guide
Gearbox Vibration Analysis: What the Data Really Means
Gearbox Bearing Failure: Troubleshooting Guide
Industrial Gearbox Maintenance Checklist
Sources and References
Parker Hannifin — Fiscal 2026 Fourth Quarter and Full-Year Results, August 6, 2026
Primary source for Parker’s 19% overall order rate, 16% North American industrial orders, 24% international industrial orders and record $12.8 billion backlog.
Parker Hannifin fiscal 2026 results
Flowserve — Second Quarter 2026 Results, July 29, 2026
Primary evidence for $652.3 million in original-equipment bookings, record $695.8 million aftermarket bookings, $1.348 billion total bookings and $3.336 billion backlog.
Flowserve Q2 2026 results
Fastenal — Second Quarter 2026 Earnings, July 14, 2026
Primary source separating direct production materials from indirect/MRO materials and reporting growth of 16.5% and 14.1%, respectively.
Fastenal Q2 2026 earnings
Genuine Parts Company — Second Quarter 2026 Results, July 21, 2026
Primary source for Industrial Parts Group sales growth of 7.1% and comparable growth of 6.1%.
Genuine Parts Company Q2 2026 results
Genuine Parts Company — Industrial Parts Group Profile
Provides context on Motion’s MRO/OEM customer mix, distribution footprint and industrial replacement-parts role.
GPC Industrial Parts Group / Motion overview
The Timken Company — Second Quarter 2026 Results, August 4, 2026
Primary source for Engineered Bearings growth of 3.8%, Industrial Motion growth of 14.6%, 4.4% total organic sales growth and Timken’s updated outlook.
Timken Q2 2026 results
SKF — Second Quarter 2026 Results, July 17, 2026
Important counterevidence showing 1.4% group organic growth but flat organic sales in Bearing Solutions, continued softness in Europe and only early signs of Americas OEM improvement.
SKF Q2 2026 results
Emerson — Third Quarter 2026 Results, August 4, 2026
Additional industrial-capital-demand evidence: underlying orders increased 7% and underlying sales increased 6%, with broad-based growth in North America and Asia.
Emerson Q3 2026 results
National Institute of Standards and Technology — Asset Condition Management
Independent technical context explaining how condition awareness, diagnostics and estimates of future equipment health support predictive-maintenance decisions.
NIST Asset Condition Management framework
Association of Asset Management Professionals — P-F Interval, April 6, 2026
Independent reliability context defining the interval between detectable potential failure and functional failure and explaining its role in maintenance planning.
Why should we care about the P-F interval?