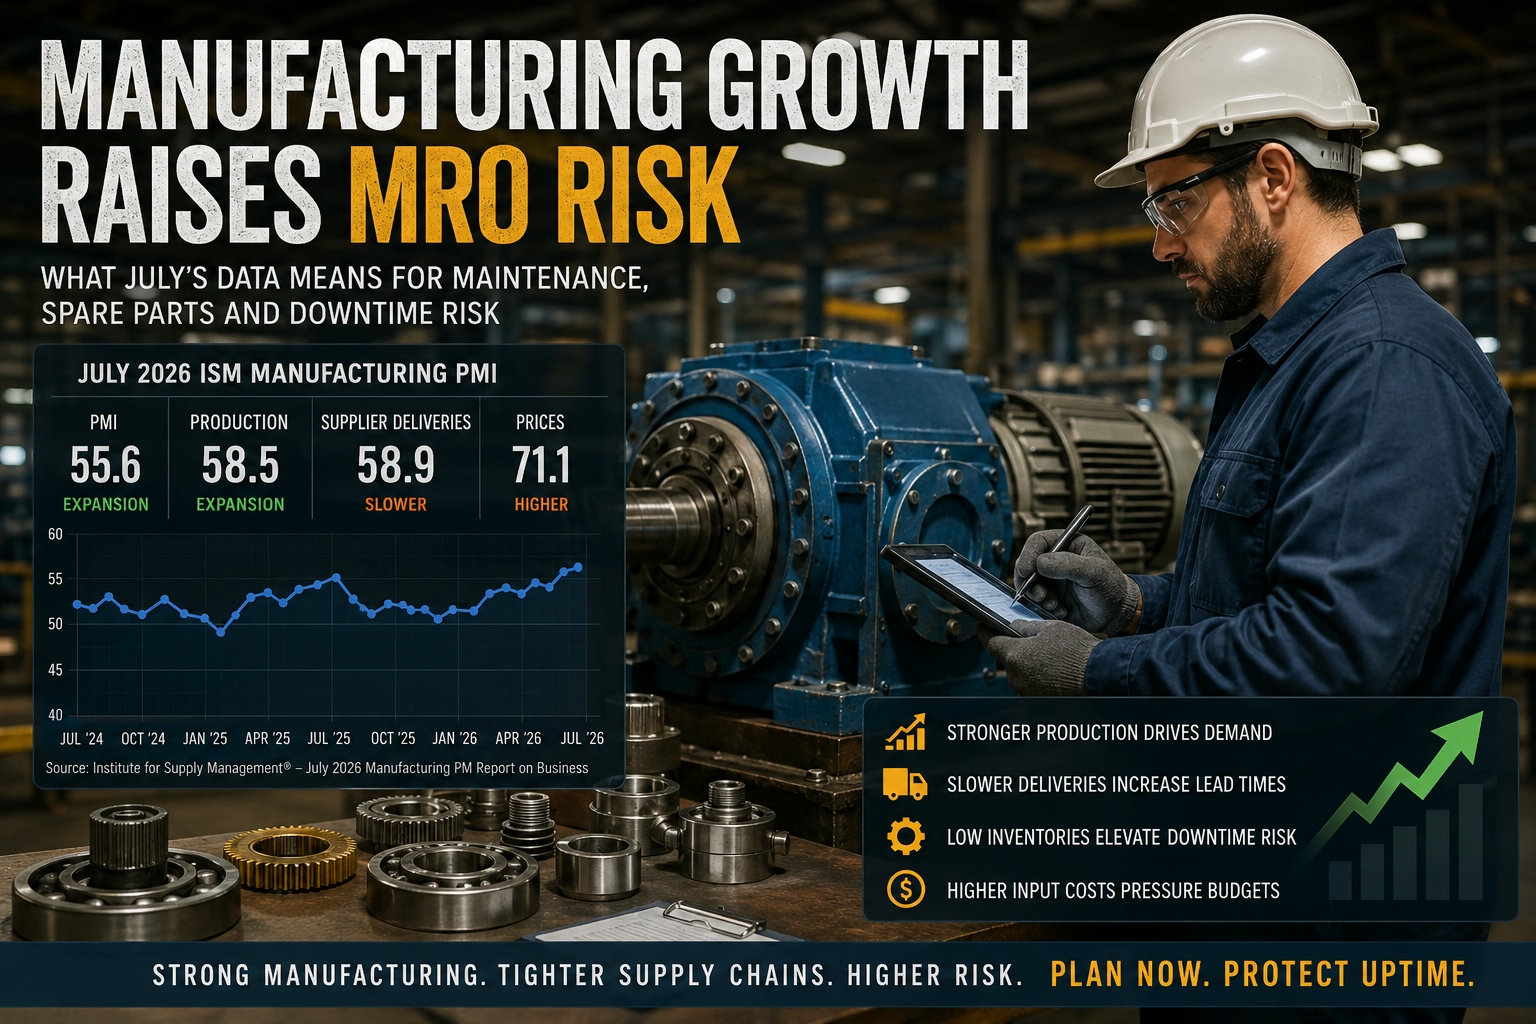
U.S. manufacturing activity accelerated sharply in July, but the same data that point to stronger production also expose a more difficult operating environment for maintenance, reliability and MRO teams.
The Institute for Supply Management’s July 2026 Manufacturing PMI report, released August 3, placed the headline index at 55.6 percent—2.3 percentage points above June and its highest reading since May 2022. New orders, production, employment and order backlogs all expanded. At the same time, supplier deliveries slowed further, customers’ inventories remained too low and raw-material prices increased for the 22nd consecutive month.
For industrial equipment owners, this is not simply an encouraging demand report. It describes a combination that can increase operating risk: more production pressure, less tolerance for planned downtime, tighter replacement-part availability and greater cost uncertainty for metals, electrical components, lubricants and repair inputs.
The central maintenance question is therefore not whether manufacturing is expanding. It is whether plants are prepared to support higher utilization without allowing short-term output demands to defer the inspections, repairs and spare-parts decisions that protect critical gearboxes, motors, bearings and drive systems.
Quick Take

July’s manufacturing expansion is positive for industrial demand, but it is not an operational all-clear. Faster production, growing backlogs, slower supplier deliveries, low customer inventories and elevated input prices can leave plants running critical equipment harder while carrying less repair and inventory flexibility. Reliability plans should be reviewed before stronger demand becomes deferred maintenance.
Key Takeaways
- The July Manufacturing PMI reached 55.6 percent, its highest level in more than four years.
- Production rose to 58.5 percent, while backlogs increased to 55 percent and customers’ inventories fell deeper into “too low” territory.
- Supplier deliveries slowed across 13 manufacturing industries, including machinery, fabricated metals, primary metals and electrical equipment.
- ISM identified shortages involving electrical and electronic components, semiconductors, copper, aluminum, steel, rare-earth components and oil-based products.
- Plants should treat stronger manufacturing demand as a reason to strengthen condition monitoring, critical-spares planning and repair-versus-replace preparation—not postpone them.
What the July Manufacturing Report Shows
The July report marked the seventh consecutive month of expansion for the U.S. manufacturing sector. ISM’s headline index increased from 53.3 percent in June to 55.6 percent in July. Four of the six largest manufacturing industries—transportation equipment, machinery, computer and electronic products, and food, beverage and tobacco products—expanded during the month.
The Production Index rose 6.3 percentage points to 58.5 percent, its highest reading since November 2021. New Orders registered 56.7 percent, the Backlog of Orders Index rose 4.5 points to 55 percent and Employment returned to expansion at 52.8 percent after 33 months outside growth territory.
By the Numbers: July 2026 Manufacturing
- 55.6: Manufacturing PMI, up from 53.3 in June
- 58.5: Production Index, up 6.3 percentage points
- 56.7: New Orders Index
- 55.0: Backlog of Orders Index
- 58.9: Supplier Deliveries Index, indicating slower deliveries
- 40.7: Customers’ Inventories Index, classified as too low
- 71.1: Prices Index, showing continued raw-material price increases
Source: Institute for Supply Management, July 2026 Manufacturing PMI report.
Those figures describe a broad improvement in business conditions. They also describe an operating environment in which a greater share of manufacturers may be increasing output while waiting longer for inputs and rebuilding depleted customer inventories.
That combination matters to maintenance because equipment risk is driven not only by the technical condition of an asset, but also by the operating demands and recovery options surrounding it. A gearbox with rising vibration is a different management problem when a replacement bearing is available in the storeroom and a planned outage is possible. The same condition becomes more consequential when production is accelerating, the customer is short on inventory and the required component has an extended lead time.
Industrial Gearbox Solutions Editorial Insight
Manufacturing growth changes the consequence of equipment risk before it changes the failure mechanism. The bearing, gear or motor may deteriorate in the same way, but the plant has fewer acceptable opportunities to intervene.
The PMI Is Strong—but It Is Not a Measure of Machine Loading
The July report should not be interpreted as direct proof that every manufacturing plant is operating at full capacity. ISM’s indexes are diffusion measures based on whether surveyed supply executives report conditions as higher, the same or lower than the previous month. Diffusion indexes summarize the direction and breadth of change; they do not measure physical production volume, operating hours or the load on an individual asset.
That distinction is important because the most recent Federal Reserve production data were more restrained. The Federal Reserve’s June 2026 Industrial Production and Capacity Utilization release reported that manufacturing output was unchanged in June, although it increased at a 4.7-percent annual rate during the second quarter. Manufacturing capacity utilization was 75.7 percent, 2.5 percentage points below its 1972–2025 average.
ISM’s July survey may indicate that momentum improved after the June results, but July’s official industrial-production data are scheduled for release on August 18. The responsible interpretation is therefore conditional: manufacturing momentum strengthened materially in July, but the extent to which that survey improvement translates into higher physical output, asset utilization and equipment demand will vary by facility and sector.
Common Analytical Mistake
Treating a PMI reading as if it were a utilization percentage. A PMI of 55.6 does not mean factories are operating at 55.6 percent capacity or producing 5.6 percent more material. It indicates that manufacturing conditions generally expanded compared with the previous month.
1. Faster Production Can Reduce Maintenance Flexibility
The production and backlog readings are the most direct reliability signal in the report. When output increases and order backlogs grow at the same time, maintenance windows can become harder to obtain. Operations teams have a stronger incentive to continue running assets that remain functional, even when condition-monitoring data show developing defects.
This does not mean higher production automatically causes gearbox failure. Mechanical failures still require a specific pathway such as lubrication breakdown, contamination, misalignment, overload, fatigue, bearing damage or installation error. However, higher throughput can accelerate existing degradation by increasing operating hours, thermal cycles, starts, load changes or time spent near design limits.
The risk is especially important for assets that already have unresolved findings. Examples include increasing gear-mesh sidebands, rising bearing temperatures, repeated seal leakage, elevated wear metals, unstable motor current, oil-level loss or a history of coupling misalignment. Stronger production demand does not make those indicators less significant. It makes the cost of a forced outage greater and the opportunity to correct the condition smaller.
Plants should review whether current monitoring intervals reflect the expected operating schedule. An asset moving from intermittent duty to sustained production may need more frequent review even if its alarm limits remain unchanged. Maintenance planners should also identify which work can be performed during brief process interruptions and which tasks require a controlled shutdown.
For related guidance, see the Gearbox Condition Monitoring Guide, Gearbox Vibration Analysis: What the Data Really Means and Gearbox Duty Cycles Explained.
Reliability Tip
When production plans change, review monitoring frequency—not only alarm values. More operating hours between inspections can allow a defect to progress further even when the underlying failure threshold has not changed.
2. Slower Supplier Deliveries Shrink the Repair Buffer
ISM’s Supplier Deliveries Index increased to 58.9 percent in July, indicating that deliveries slowed at a faster rate than in June. Thirteen industries reported slower supplier performance, and no industry reported faster deliveries. Machinery, fabricated metal products, primary metals, electrical equipment, transportation equipment and computer and electronic products were among the affected sectors.
For gearbox and rotating-equipment maintenance, supplier delay is not a generic procurement problem. It changes the decision window available after a defect is discovered.
A plant may be able to monitor a stable bearing defect while a planned repair is prepared. That strategy becomes less defensible when the replacement bearing, seal, shaft, coupling or gear set cannot arrive before the projected deterioration window. Likewise, a repairable gearbox cannot be treated as an immediately available spare when transportation, inspection, machining, heat treatment, replacement components and testing all require uncertain lead time.
The July report’s shortage list included aluminum, copper, electrical and electronic components, integrated circuits, printed circuit boards, rare-earth components, semiconductors, steel, hot-rolled steel, tungsten products and oil-based products. Those materials flow into motors, drives, sensors, controls, housings, shafts, gears, lubrication products and the equipment used to repair them.
Maintenance and purchasing teams should distinguish between three forms of availability:
- Catalog availability: A part number exists and can be quoted.
- Inventory availability: The correct part is physically available for shipment.
- Application readiness: The part is technically compatible, documented and capable of being installed without creating another risk.
A nominal substitute that changes bearing clearance, seal material, shaft fit, lubricant compatibility, motor characteristics or load capacity may solve a purchasing problem while creating a reliability problem.
For additional planning context, see Industrial Gearbox Lead Times Explained.
What This Means for MRO
Critical-spares policy should be based on failure consequence, deterioration time and replenishment time—not purchase price alone. A component that appears expensive in inventory may be inexpensive compared with the production exposure created when a known defect develops faster than the supply chain can respond.
3. Low Customer Inventories Increase the Pressure to Keep Running
The Customers’ Inventories Index fell to 40.7 percent in July and remained in “too low” territory. ISM generally views low customer inventories as supportive of future production because customers may need to replenish stock.
That is encouraging for orders. It can be challenging for maintenance governance.
When customers have little inventory, late deliveries can affect downstream production quickly. Plant managers may face pressure to protect output, defer preventive work or accept temporary repairs. Those decisions are not always wrong; risk-based maintenance requires balancing equipment condition, process needs, safety and available alternatives. The problem arises when the decision is made without documenting the technical evidence and the consequences of continued operation.
Facilities should establish in advance which conditions can be monitored, which require load reduction and which demand an immediate shutdown. Decision criteria should be based on machine-specific data, OEM requirements, qualified engineering review and site procedures—not the urgency of a customer order.
A useful escalation framework should identify:
- The observed condition and its rate of change
- The evidence required to confirm the likely failure mode
- The probability and consequence of continued operation
- The availability of redundancy, bypass capacity or alternate production
- The repair scope and expected lead time
- The operating limits that trigger shutdown
- The person authorized to accept the documented risk
Common Maintenance Mistake
Allowing production urgency to replace an engineering decision. Continued operation may be justified in some cases, but the decision should state what is known, what remains uncertain, which limits apply and what evidence will trigger intervention.
4. Price Relief Is Uneven Across Industrial Inputs
ISM’s Prices Index remained elevated at 71.1 percent in July. Although the reading declined from June, it still indicated that raw-material prices increased for the 22nd consecutive month. Five of the six largest manufacturing industries reported higher prices.
The broader inflation picture is mixed. The Bureau of Labor Statistics’ June Producer Price Index release showed final-demand prices falling 0.3 percent during the month, largely because final-demand goods declined. Yet final demand remained 5.5 percent above its year-earlier level.
Broad price indexes can conceal increases in specific industrial categories. The BLS industrial-machinery manufacturing index, available through the Federal Reserve Bank of St. Louis FRED database, increased from 269.325 in May to 270.349 in June—approximately 0.4 percent in one month.
ISM respondents also reported price increases for steel, aluminum, copper, electrical components, electronic components, freight, fuel, oil-based products, metal products, printed circuit boards and semiconductors. Together, those inputs complicate budgeting for motors, controls, fabricated components, bearings, lubrication equipment and gearbox rebuilds.
Maintenance budgets built from last year’s component prices may therefore understate the funds needed to execute the same work. The better response is not indiscriminate pre-buying. It is to identify the components with the highest combination of criticality, lead-time exposure, obsolescence risk and price volatility.
Real-World Supply-Chain Warning
“Disruption is no longer an exception. It is an ongoing reality.”
— Debbie Fogel-Monnissen, ISM Interim CEO, in ISM and Amazon Business supply-chain research
The study, based on 425 global supply-chain professionals, found that 71 percent of participating organizations said balancing cost and risk drives procurement strategy, but only 45 percent considered themselves prepared for disruption. Sixty-five percent still relied on manual reporting to gather supply-chain data.
The study covers supply chains broadly rather than gearbox MRO specifically. Its operational implication is still relevant: a plant cannot respond quickly to a critical-spares problem when part identity, stock status, repair history, approved alternatives and lead times are spread across spreadsheets, emails and individual experience.
5. Power-Transmission Suppliers Were Already Seeing Stronger Demand
Company results reported earlier in 2026 provide another piece of context, although they should not be treated as proof of July’s conditions.
In its first-quarter 2026 results, Timken reported Engineered Bearings sales of $806.2 million, up 6 percent from the prior year, although volumes were flat. Industrial Motion sales increased 12 percent to $425.1 million, driven by stronger demand across most sectors, pricing and currency effects. Both segments reported incremental tariff costs.
Regal Rexnord’s first-quarter 2026 release reported enterprise daily orders up 8.5 percent from the prior year and backlog up 6.7 percent sequentially. Its Industrial Powertrain Solutions segment produced $648.2 million in net sales, up 5.8 percent, with particular strength in general industrial markets.
These company reports predate the July PMI and reflect company-specific product portfolios, markets, pricing, acquisitions and execution. They cannot establish a universal trend by themselves. However, they are consistent with the broader pattern of improving industrial demand alongside tariff and supply-chain pressure.
The danger is not growth itself. It is allowing stronger orders to consume the maintenance capacity, spare-parts margin and decision time needed to support that growth reliably.
What Maintenance and MRO Teams Should Do Now
The July report does not justify emergency purchasing or broad changes to every maintenance program. It does justify a focused review of the assets and materials most exposed to the combination of higher demand and slower replenishment.
Revalidate asset criticality
Confirm that criticality rankings still reflect current production demand, redundancy, customer commitments and replacement lead times. A gearbox serving a formerly underutilized line may now have a different production consequence.
Review open condition-monitoring findings
Identify assets with unresolved vibration, temperature, oil-analysis, leakage, alignment or electrical findings. Document the trend, likely failure mode, evidence gaps and next decision point. Do not allow the work-order backlog to conceal an equipment-risk backlog.
Compare defect-development time with replenishment time
For each critical finding, compare the estimated time available for intervention with the realistic time needed to obtain parts, approve a repair, transport the unit and return it to service. Where deterioration can progress faster than replenishment, the response may require earlier repair, a qualified alternative, load reduction or a verified spare.
Verify critical spares physically
Confirm that listed spares exist, are correctly identified, have been stored appropriately and match the current equipment configuration. An obsolete, incomplete or incorrectly preserved spare should not be counted as available capacity.
Update repair-versus-replace preparation
Gather nameplate data, drawings, ratios, shaft dimensions, mounting position, motor information, duty cycle and operating history before a failure occurs. For a structured decision framework, see When to Repair vs. Replace an Industrial Gearbox.
Protect precision-maintenance work
Higher demand should not become a justification for rushed installation, approximate alignment, unverified lubricant substitution or incomplete startup documentation. Schedule pressure changes urgency; it does not change the technical requirements for a reliable repair.
What to Review This Week
- Re-rank critical assets against current production commitments.
- Review unresolved vibration, oil-analysis and temperature trends.
- Confirm the physical condition and identity of critical spares.
- Update actual lead times for bearings, seals, motors, couplings and replacement gearboxes.
- Document acceptable alternatives before an emergency purchase is required.
- Identify maintenance work most likely to be deferred by higher production demand.
- Confirm who can authorize load reduction, planned repair or continued operation.
Questions to Ask Your Plant
- Which critical assets will accumulate the most additional operating hours if July’s demand continues?
- Do our monitoring intervals still match the expected duty cycle and production schedule?
- Which open equipment findings could become unmanageable if a replacement component is delayed?
- Are our critical spares physically verified, correctly preserved and technically compatible?
- Which parts have supplier lead times longer than the expected deterioration window of the assets they protect?
- Have production priorities begun to defer work that was originally classified as risk-reducing maintenance?
- Do maintenance, operations, engineering and purchasing use the same criteria for continued operation and shutdown?
- What evidence would trigger repair, rebuild, replacement, redesign or load reduction?
Risks, Limitations and Unanswered Questions
The July Manufacturing PMI is a timely and broad indicator, but it remains a survey-based diffusion index. It does not measure the utilization, condition or reliability of individual industrial assets.
The Federal Reserve’s official June data showed manufacturing output unchanged for the month and capacity utilization below its long-run average. July industrial-production data will provide an important test of whether the stronger survey readings translated into higher physical output.
Supply-chain shortages and slower deliveries also do not affect every facility equally. Large manufacturers may have contracted supply, internal repair capabilities and multiple approved sources. Smaller facilities may be more exposed to distributors, spot purchases and individual repair vendors.
Finally, increased production does not establish a causal link to equipment failure. The article’s conclusion is narrower: stronger demand can increase the operational consequence of an existing defect and reduce the time available to correct it.
Important Limitation
Economic indicators should guide questions, not replace plant data. Maintenance decisions must be based on actual equipment condition, operating duty, OEM instructions, applicable safety requirements, site procedures and qualified technical review.
What to Watch Next
- August 13: BLS Producer Price Index for July, including updated machinery and industrial-input pricing.
- August 18: Federal Reserve Industrial Production and Capacity Utilization for July.
- Late August and early September: Additional public-company earnings and order commentary from industrial manufacturers and distributors.
- September 1: ISM Manufacturing PMI for August, which will show whether production, supplier delays, backlogs and customer inventories continued in the same direction.
Maintenance leaders should also monitor actual lead times, expedited-freight use, emergency purchase frequency, deferred work, overtime, spare consumption and changes in condition-monitoring trends within their own facilities. Those plant-level indicators may reveal operational stress before national data do.
Industrial Gearbox Solutions Editorial Perspective
July’s manufacturing report is encouraging because stronger new orders and production can support industrial investment, employment and equipment demand. But reliable growth requires more than running existing assets for additional hours.
The combination of rising output, slower supplier deliveries, low customer inventories and elevated material prices changes the maintenance decision environment. It makes known defects more consequential, critical-spares errors more expensive and rushed repair decisions more likely.
The appropriate response is not pessimism or indiscriminate inventory building. It is operational preparation: stronger condition monitoring, verified spares, realistic lead times, documented alternatives and clear repair-versus-replace criteria. Plants that preserve those capabilities are better positioned to convert stronger demand into sustainable production rather than unplanned downtime.
Frequently Asked Questions
What does a Manufacturing PMI of 55.6 mean?
It indicates that U.S. manufacturing conditions generally expanded in July compared with June. It does not mean output increased 5.6 percent or that factories operated at 55.6 percent capacity.
Why do slower supplier deliveries matter to maintenance teams?
Longer delivery times reduce the window available to obtain bearings, seals, motors, controls, couplings and gearbox components after a defect is discovered. This can change the timing and risk of repair-versus-continue-running decisions.
Does higher production automatically increase gearbox failures?
No. A failure still requires a technical mechanism such as fatigue, lubrication breakdown, contamination, overload or misalignment. Higher production can increase operating hours and reduce maintenance opportunities, which may accelerate or increase the consequence of an existing problem.
Should plants increase spare-parts inventory because the PMI increased?
Not across the board. Plants should focus on components with high asset criticality, long or unstable lead times, limited alternatives, obsolescence exposure and a significant consequence of stockout.
Which plant data should be reviewed alongside economic indicators?
Useful measures include operating hours, load, deferred maintenance, emergency purchases, lead times, spare consumption, vibration trends, oil-analysis results, temperature trends, repeat failures and the backlog of unresolved equipment findings.
Related Reading
- Gearbox Condition Monitoring Guide
- Gearbox Vibration Analysis: What the Data Really Means
- Industrial Gearbox Lead Times Explained
- When to Repair vs. Replace an Industrial Gearbox
- Industrial Gearbox Maintenance Checklist
- Gearbox Duty Cycles Explained
- Industrial Motor Repair
Sources
- Institute for Supply Management—July 2026 Manufacturing PMI Report
- Federal Reserve—Industrial Production and Capacity Utilization, June 2026
- U.S. Bureau of Labor Statistics—Producer Price Indexes, June 2026
- FRED—Producer Price Index for Industrial Machinery Manufacturing
- ISM and Amazon Business—Supply-Chain Preparedness Research
- Timken—First-Quarter 2026 Results
- Regal Rexnord—First-Quarter 2026 Results
Need to Prepare for a Gearbox Repair or Replacement?
When production demand is increasing, gathering equipment information before a failure can shorten the time needed to evaluate repair, rebuilding, replacement or interchange options.
Document the gearbox nameplate, ratio, shaft arrangement, mounting position, motor information, duty cycle, operating symptoms, available condition-monitoring data and required production timeline.
For service information, review industrial gearbox repair, replacement and interchange options.